

Combining LLMs and Knowledge Graphs: A Practical Guide
I. knowledge graph
A Knowledge Graph (KG) is a structured map of a domain. Each point (node) represents a real-world entity (e.g., client, product, equipment, person, document, contract, location, event) and each line (edge) captures the relationship connecting them (e.g., who is where, who does what, with what, when, according to what rule). Where a classic database requires knowing the right table and the right join, a KG allows you to navigate naturally from one thing to another and explain an answer by the links traversed.
A KG becomes particularly valuable when information is scattered across multiple systems (operations, HR, purchasing, maintenance, risk, documents). Rather than multiplying queries and exports, the KG connects these silos and preserves the origin of each fact. Result: reliable, traceable, and actionable answers.
1. Concrete example in a hospital
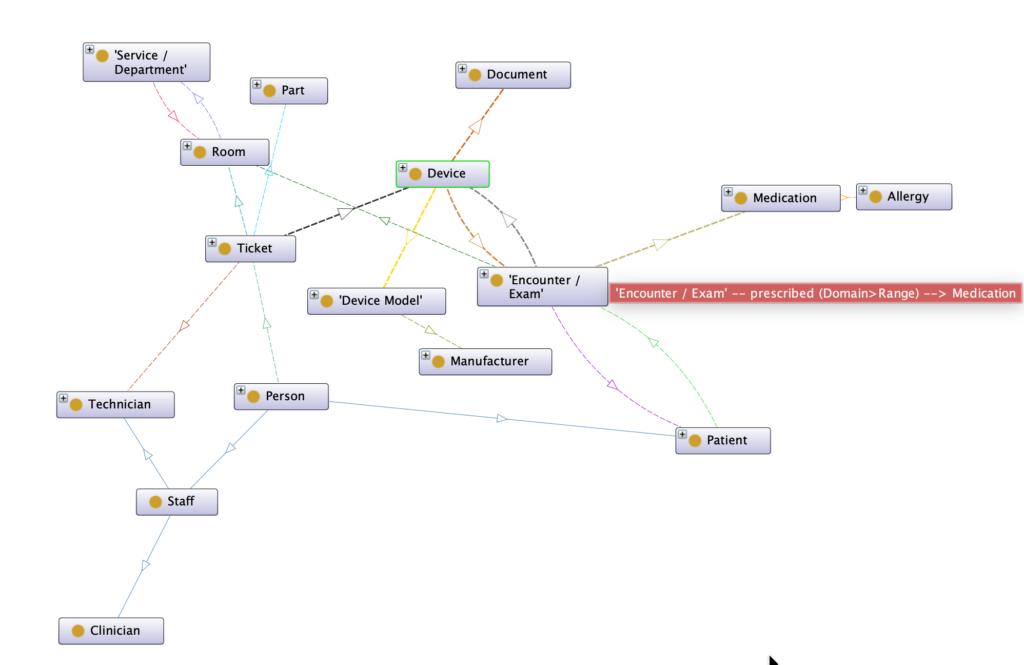
Consider a real-world example: a patient, Ms. Doe, had an MRI in Room 2 using MRI device A17. In her satisfaction survey, she reports that “the lights are not working.”
In a KG, we connect:
Ms. Doe → MRI exam → Room 2 → MRI device A17 → Assigned technician → Ticket #4521 → Part Starter-LAMP-X
Thanks to these relationships, an assistant can provide a clear answer:
- “A ticket was opened 2 hours ago. Maintenance is scheduled for 14:00 by Mr. Martin. The required part is in stock.”
- It can also automatically notify the responsible manager if the delay exceeds the SLA.
The same principle applies beyond healthcare: in industry, you connect machines, sensors, parts, interventions, and non-conformities; in finance, clients, products, transactions, and risks; in the public sector, projects, grants, beneficiaries, and indicators.
2. Why not a simple RAG?
A knowledge graph represents information through explicit relationships. It turns a human reasoning process into a structured path that an LLM can follow and verify.
Instead of retrieving isolated text snippets via semantic search, the system relies on actual relationships between entities to reconstruct context and, when relevant, infer new connections.
In Ms. Doe’s example, the satisfaction survey is linked to the MRI exam, Room 2, device A17, the technician, and the ticket. From the data already present in the graph, we can deduce the relationship Ms. Doe → Exam Room without relying on brittle heuristics or ambiguous keywords.
In summary: while RAG excels at retrieving and summarizing textual content, a Knowledge Graph models real-world relationships and provides an auditable chain of evidence.
- RAG: semantic search over text, without explicit relationships between entities. Ideal for retrieving and summarizing content.
- Graph RAG: combines relational structure with document retrieval, enabling navigation between entities (who, what, where, when), traceability, and supporting documents.
II. Integrating an LLM with a Knowledge Graph
An LLM is excellent for understanding and reformulating questions in natural language, but it needs reliable facts to answer without hallucinating. Hence the interest in plugging the LLM into the KG via controlled tools:
- Queries on the graph to retrieve up-to-date facts. In practice: SPARQL for an RDF graph, or equivalent queries for property graphs. The LLM generates a query, it is executed, and the results are cited in the response.
- RAG and GraphRAG to leverage documentation: procedures, manuals, reports, field notes. The LLM retrieves relevant passages and produces a response with references.
- Model Context Protocol to standardize how the assistant accesses tools: a “universal port” where we plug queries, search, files, etc., without depending on an ad hoc integration.
1. Security and compliance
- Segmentation by access: RBAC/ABAC so that everyone sees only what they are allowed to see. A board member does not access the same details as a technician.
- Protection of sensitive data: Pseudonymization in the graph, re-identification on the source system side only. The LLM responses mask unauthorized fields.
- Traceability by design: Each response includes citations: equipment identifier, link to the ticket, reference to a document or event. Useful for audit and quality.
- Execution guardrails: Time limits, quotas, result size, query validation (known schema + understandable error messages), and logging.
2. Minimal Playbook
- Detect the intent and key entities of the question.
- Route to the appropriate tool: query on the graph if the answer is factual; RAG/GraphRAG if it depends on documents.
- Generate and execute the query, repair in case of error (schema, prefixes, filters).
- Synthesize a short response, cite sources, display a mini-subgraph or a table.
- Log the query, response time, access, and user satisfaction.
III. Flexibility of usage: who wins on a daily basis
- Board of Directors: “Which units or teams show the longest maintenance delays?” → Table by entity, monthly trend, analysis of irritants reported by users or open incidents.
- Business Expert or Doctor: “Is this treatment contraindicated for this file?” → Crossing rules ↔ file data ↔ reference repositories, with explanations and references.
- Operations Manager: “Which critical equipment will have maintenance due within 7 days?” → Prioritized list, responsible parties, missing parts, impact estimation.
- Field Technician: “Give me the correct manual for model XYZ and the startup checklist” → Up-to-date document, key steps, links to similar tickets.
- Risk/Compliance Analyst: “What recent events link a supplier to quality incidents?” → Explainable subgraph, trend, recommendations.
- Data Steward: “Which entities are orphaned or poorly typed?” → Integrity checks, correction proposals.
Same assistant, different views depending on the user profile, with the same guarantees of security, traceability, and transparency.
IV. Technical implementation – concrete, references, and best practices
1. Reference Architecture
- Ingestion: Extraction of data from source systems (API, files, sensor streams), normalization of identifiers, value dictionaries.
- Modeling: Choice of a graph model (RDF/OWL or property graph) according to usage; alignment with existing vocabularies when relevant.
- Graph Construction: Creation of nodes and relationships, integrity checks (uniqueness, cardinalities), deduplication, and identity resolution.
- Hybrid Indexing:
- Graph: Neighborhoods, multi-hop paths, communities.
- Text: Keyword search (BM25) and vectors for semantics.
- Query Catalogue: SPARQL/Cypher examples and schema exposed to the LLM.
- Assistant: Router that chooses the tool (graph query vs RAG/GraphRAG), prompt templates with citations, and integrated access policies.
- Observability: Metrics (latency, success rate, context length), access logs, data quality supervision.
- Improvement Loop: Collection of frequent questions, addition of query examples, adjustment of schema and routing rules.
2. Best practices to remain sustainable
- Start small: Two or three visible use cases, with a measurable before/after.
- Separate schema and content: An index for the schema + query examples, another for the content; the router chooses.
- Standardize tools: Expose SPARQL and search via a protocol like Model Context Protocol to avoid fragile bespoke integrations.
- Test queries: Goldens on key questions, alerts when a query changes result without data modification.
- Governance: Version ontologies and mappings, review access and logging, trace modeling decisions.
- Data Quality: Automatic checks (values out of range, orphaned entities), freshness dashboards.
- Cost and Performance: Set realistic timeouts, limit traversal depth, sample large results, cache recurring subgraphs.
- Explainability: Always display the chain of evidence (links traversed, documents cited) in the interface.
3. Indicators to follow
- Success rate of queries (on graph tool) and P95 latency.
- Perceived accuracy of responses (samples rated by users).
- Reuse of the query catalogue (how many examples cover how many questions).
- Operational impact: Average resolution time, incidents avoided, user satisfaction.
4. Examples of assistant responses
“Room 2: 3 lighting reports + 1 ticket in progress (technician: Mr. Martin, part Starter-LAMP-X, ETA 14:00). Trend: increase in incidents week N-1. Recommendation: preventive verification of fixtures.”
“Workshop A: two critical machines out of service in five days due to lack of part ABC-123. Option: bulk order and advanced maintenance plan.”
4. links
- SPARQL 1.1 – W3C: https://www.w3.org/TR/sparql11-overview/
- SPARQL 1.1 Query – W3C: https://www.w3.org/TR/sparql11-query/
- RDF 1.1 Concepts – W3C: https://www.w3.org/TR/rdf11-concepts/
- GraphRAG – Microsoft Research: https://www.microsoft.com/en-us/research/project/graphrag/
- Model Context Protocol: https://modelcontextprotocol.io/
- LLM + Knowledge Graph Research Panorama: https://arxiv.org/ (search “LLM Knowledge Graph survey”)


